Super simulations
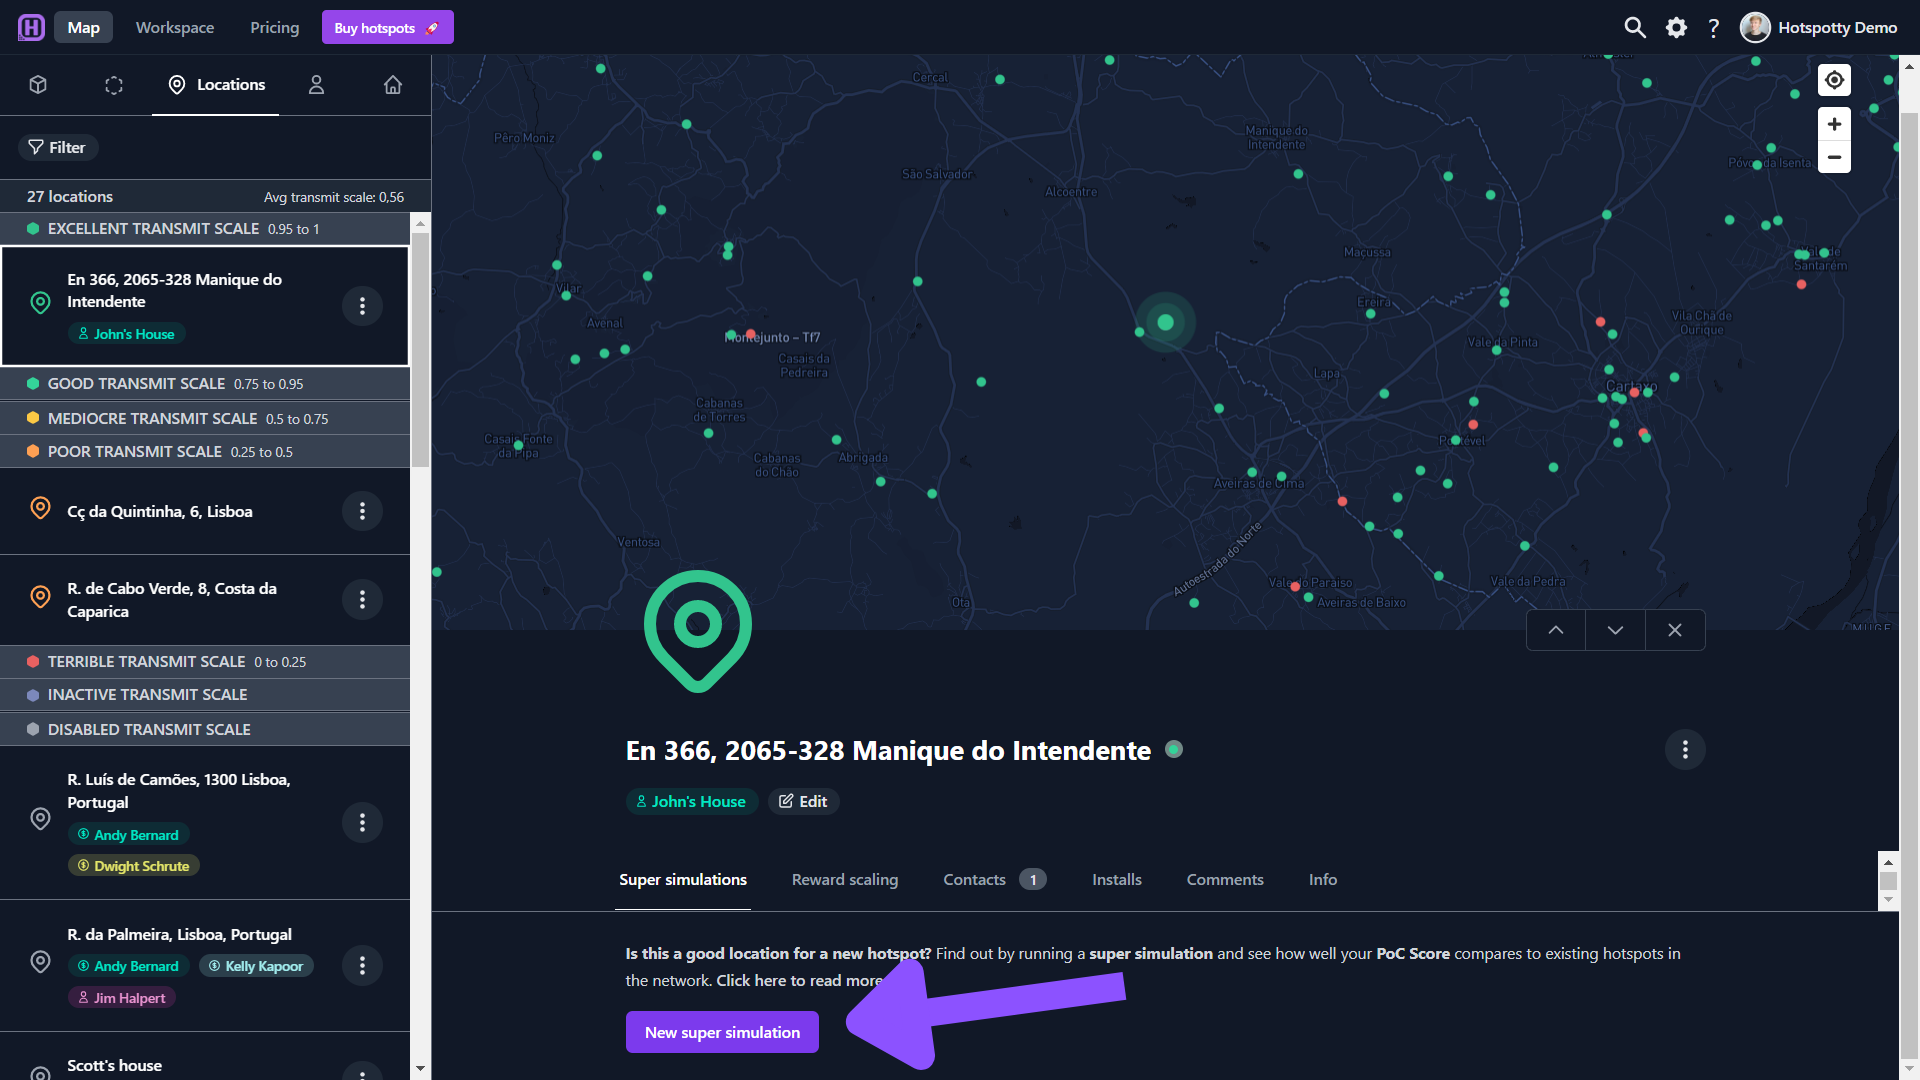
Check if a location would be suitable to place a hotspot. Find out by running a super simulation and see how well your PoC Score compares to existing hotspots in the network.
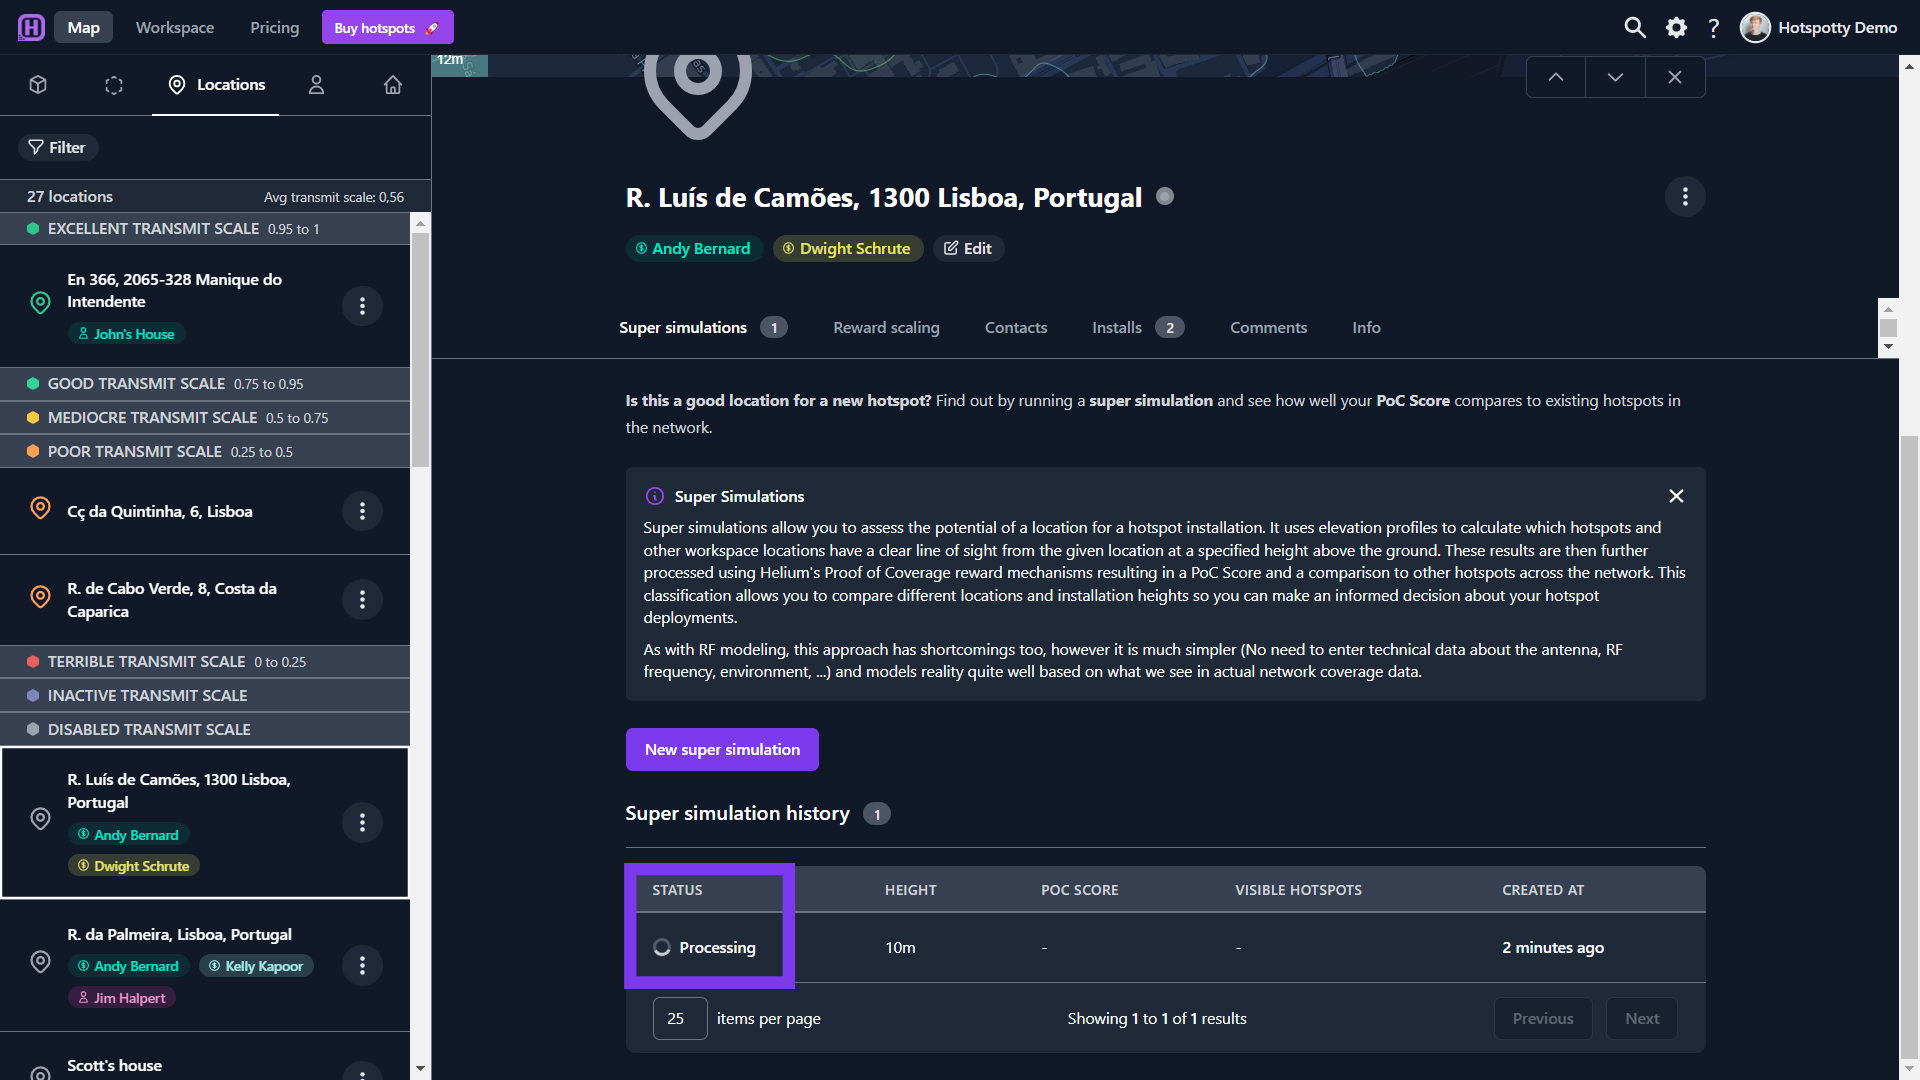
Super simulations allow you to assess the potential of a location for a hotspot installation. It uses elevation profiles to calculate which hotspots and other workspace locations have a clear line of sight from the given location at a specified height above the ground. These results are then further processed using Helium's Proof of Coverage reward mechanisms resulting in a PoC Score and a comparison to other hotspots across the network. This classification allows you to compare different locations and installation heights so you can make an informed decision about your hotspot deployments. As with RF modeling, this approach has shortcomings too, however it is much simpler (No need to enter technical data about the antenna, RF frequency, environment, ...) and models reality quite well based on what we see in actual network coverage data.
Run a super simulation
Make sure you have the location added to your workspace that you want to run a super simulation for. Check out this article on how to add locations.
Under the Locations tab in your workspace: click on Run Super Simulation next to the desired location name.
Alternatively you can choose a location via the Hotspotty map and run a simulation from there.
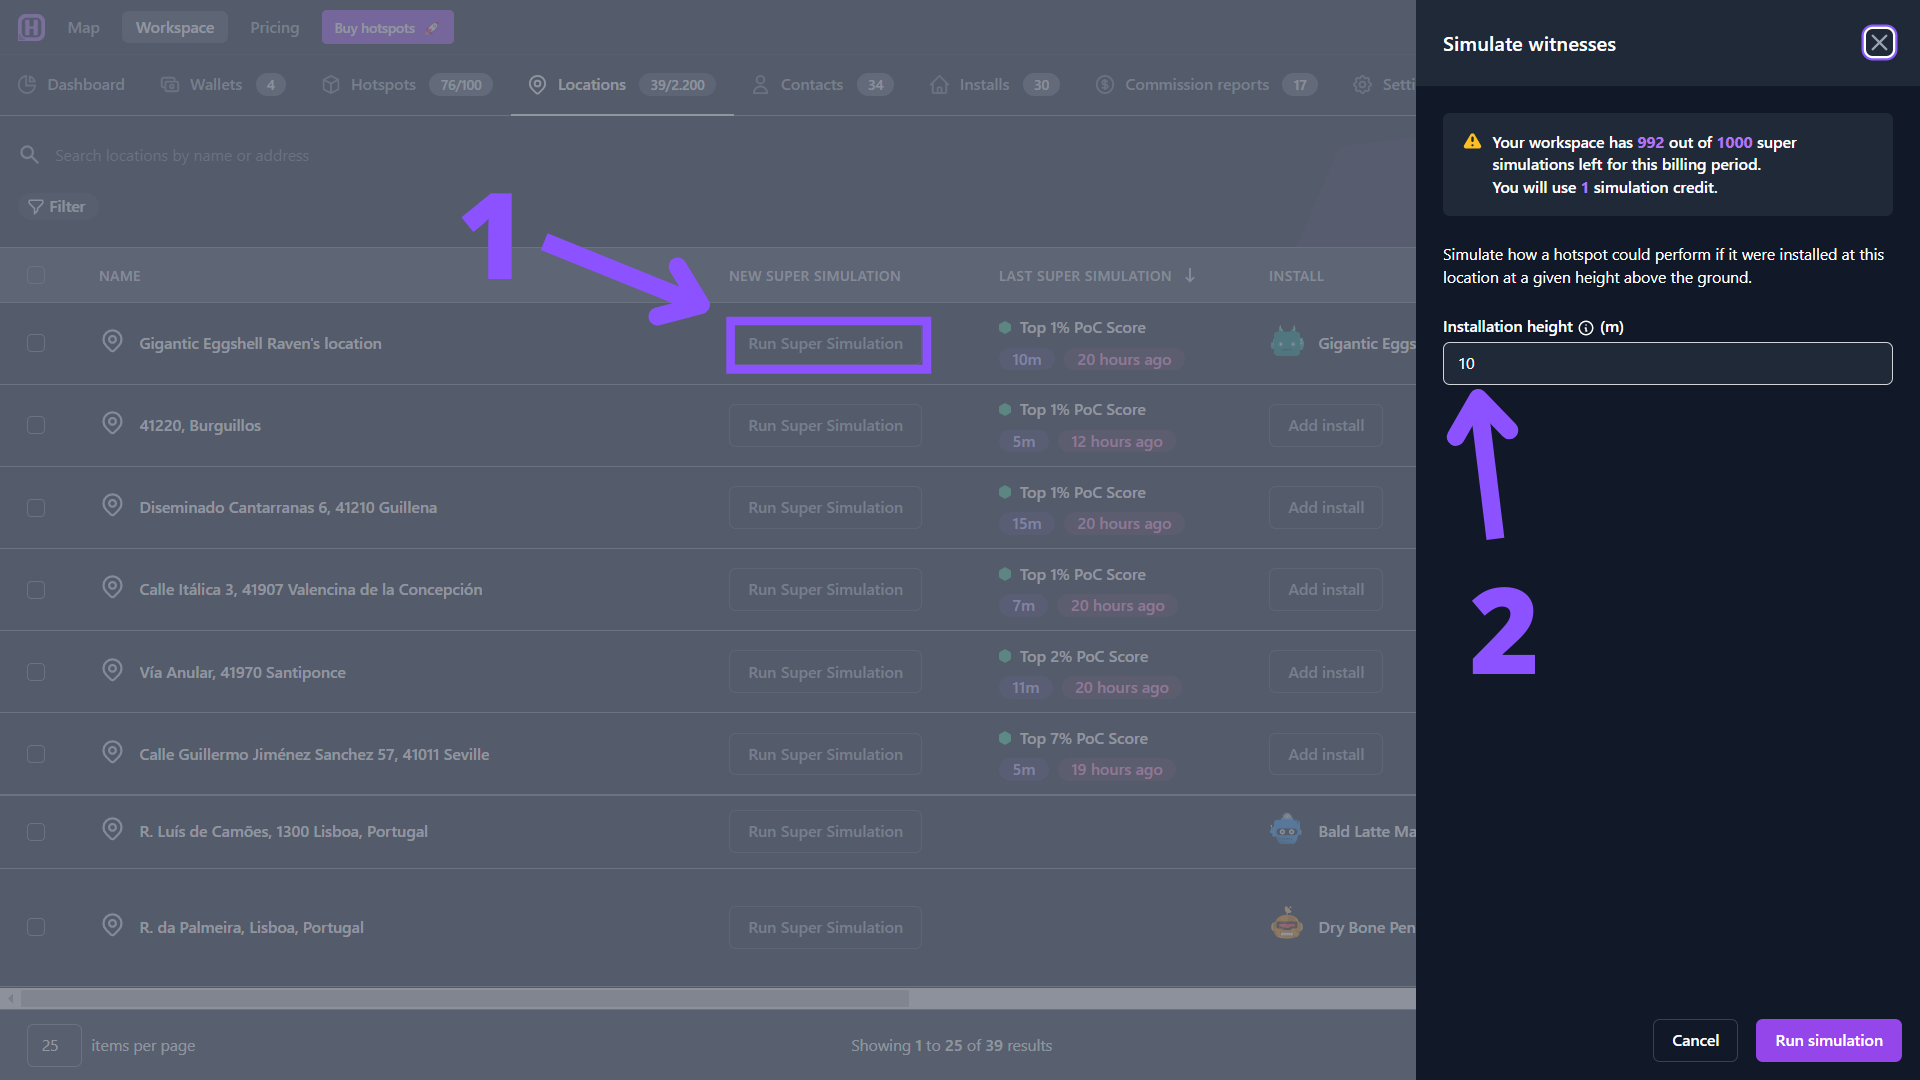
Enter the installation height (= antenna height above the ground) to simulate how a hotspot could perform if it were installed at this location at that given height above the ground.
Depending on your preference you may want to enter the installation height in metric or imperial units. How can I change the distance unit?
- Click
By running a super simulation, 1 simulation credit will be used. You can buy super simulation credits for your workspace here.
- It takes some time to run the calculations. The process should not take longer than a few minutes. You will receive an email once the super simulation is finished. The status will change to when processing is done.
Run multiple super simulations at once
If you want to build a network, it is interesting to check several locations so you can get a good idea of which locations are best for placing a hotspot. Hotspotty makes it possible to check a lot of locations with just a few clicks. Checkout out Import bulk locations via a .kml or .csv file if you are interested in importing a lot of locations at once.
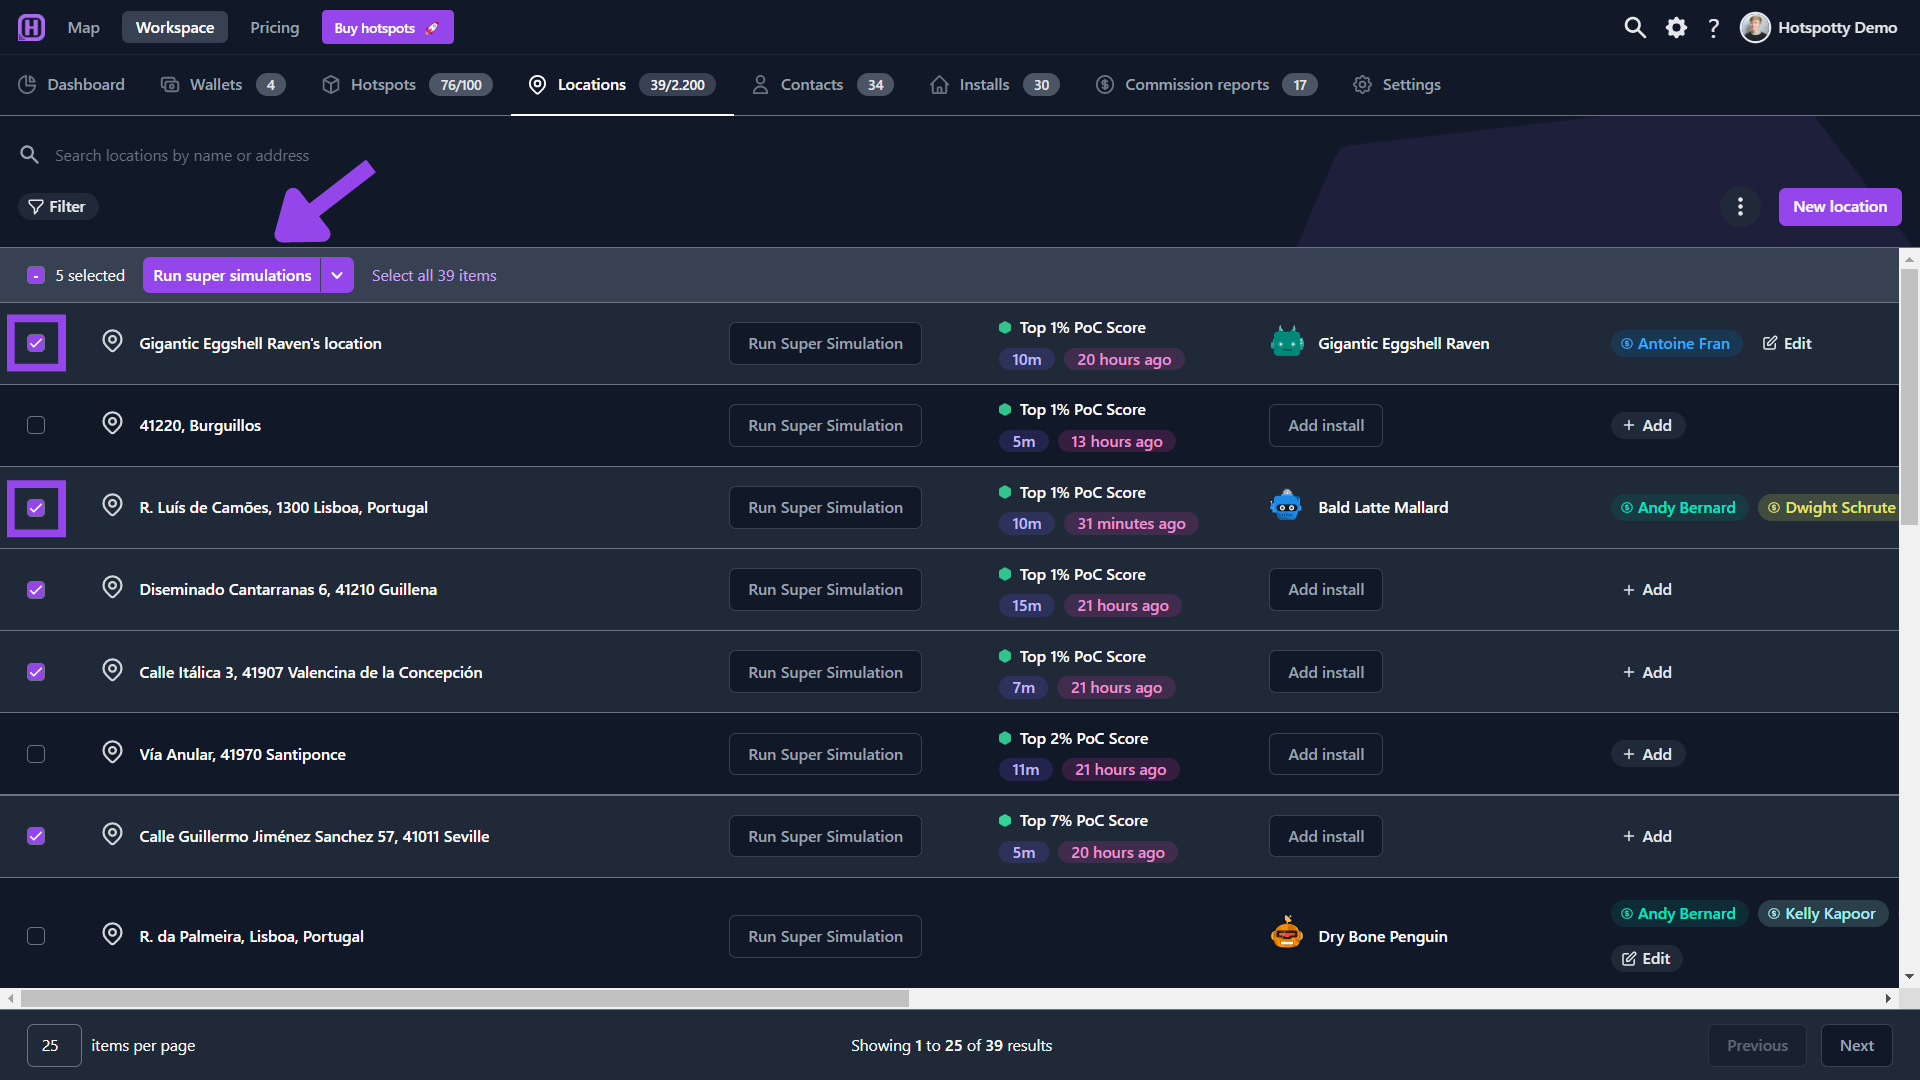
- Go over to your Locations in your workspace.
- Select the locations you want to run super simulations for by checking their boxes at the far left of the location names.
- Click
- Each location you selected will require 1 simulation credit.
- A default height of 10m is used, unless you added a custom height to your locations.
- You will receive an email when the super simulations are ready.
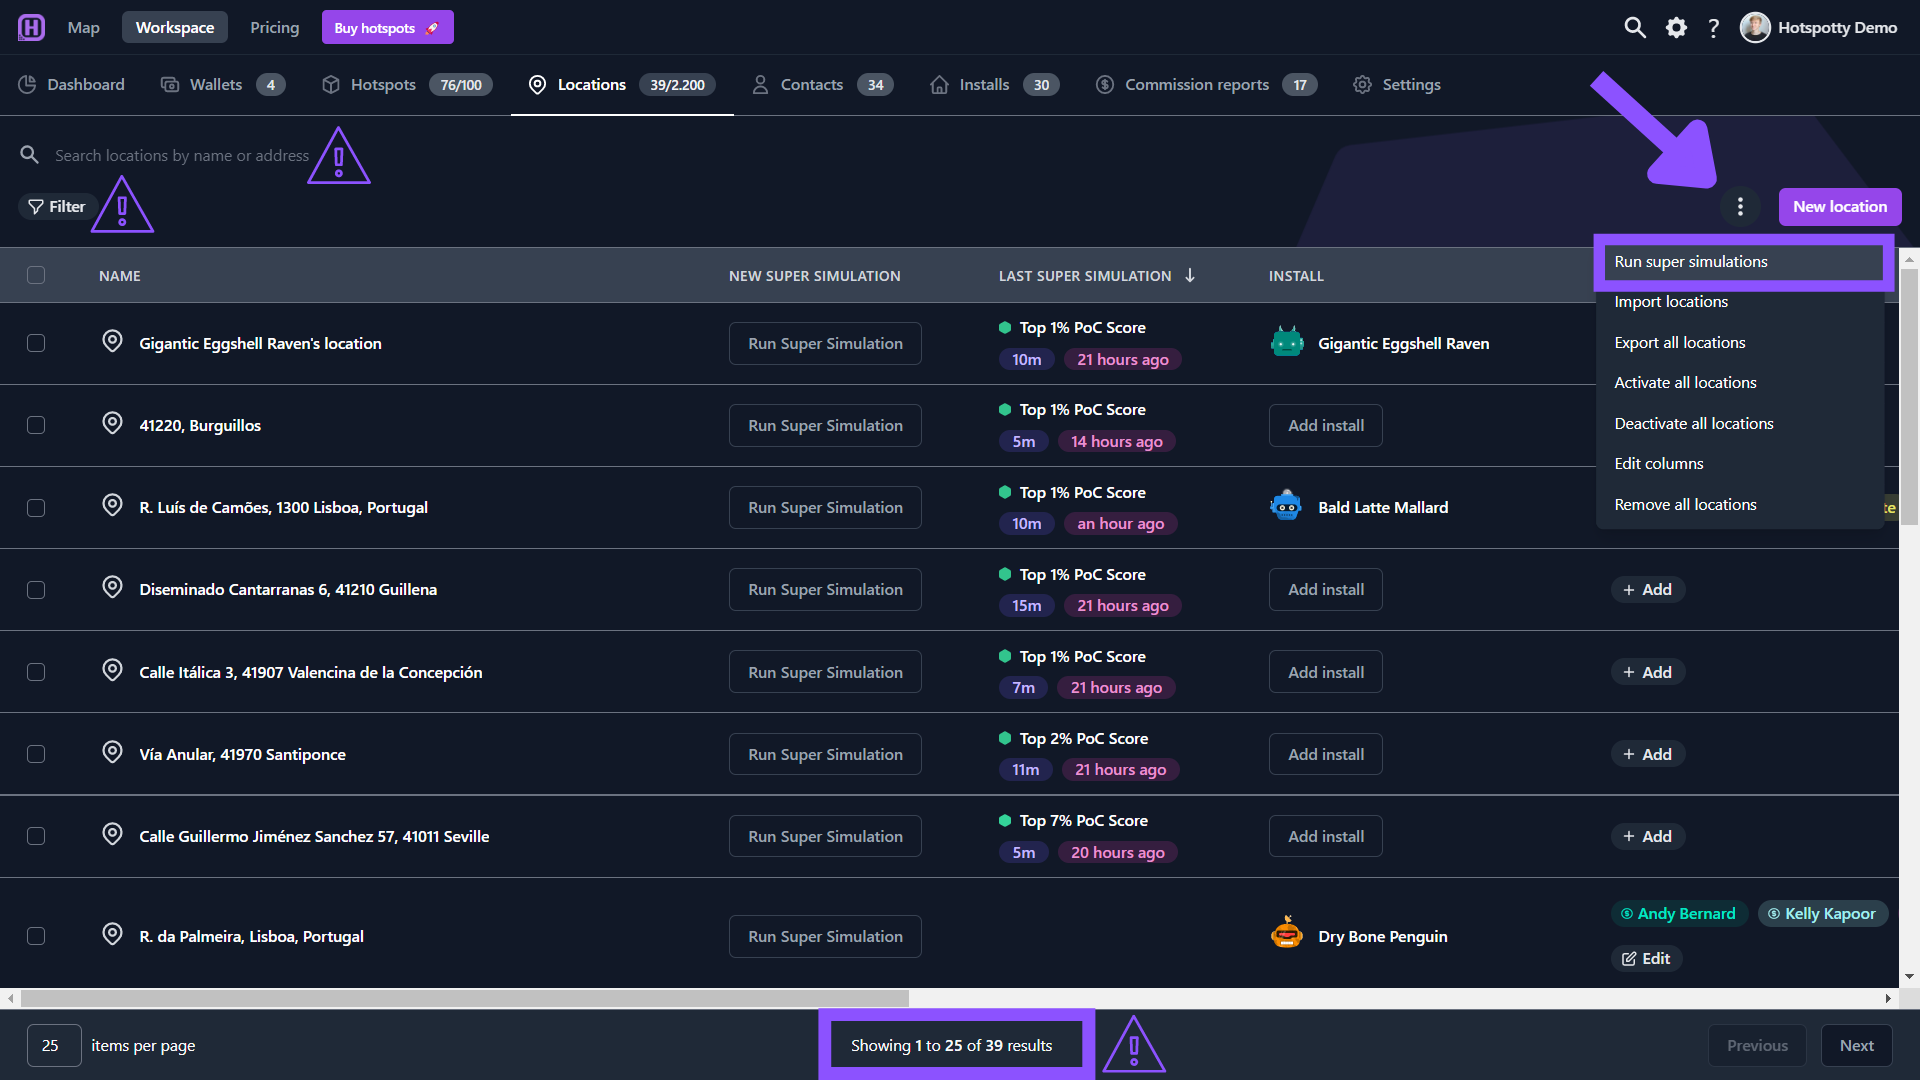
Alternatively you can run super simulations for all your locations. Click on the 3 dots next to and choose Run super simulations.
Be aware of the following when doing this:
- By default all locations will be used except if you have applied filters or you searched for locations by name or address. In short: for all the results, super simulations will be run.
- Each location will require 1 simulation credit.
- A default height of 10m is used, unless you added a custom height to your locations.
- You will receive an email when the super simulations are ready.
Interpret the super simulation results
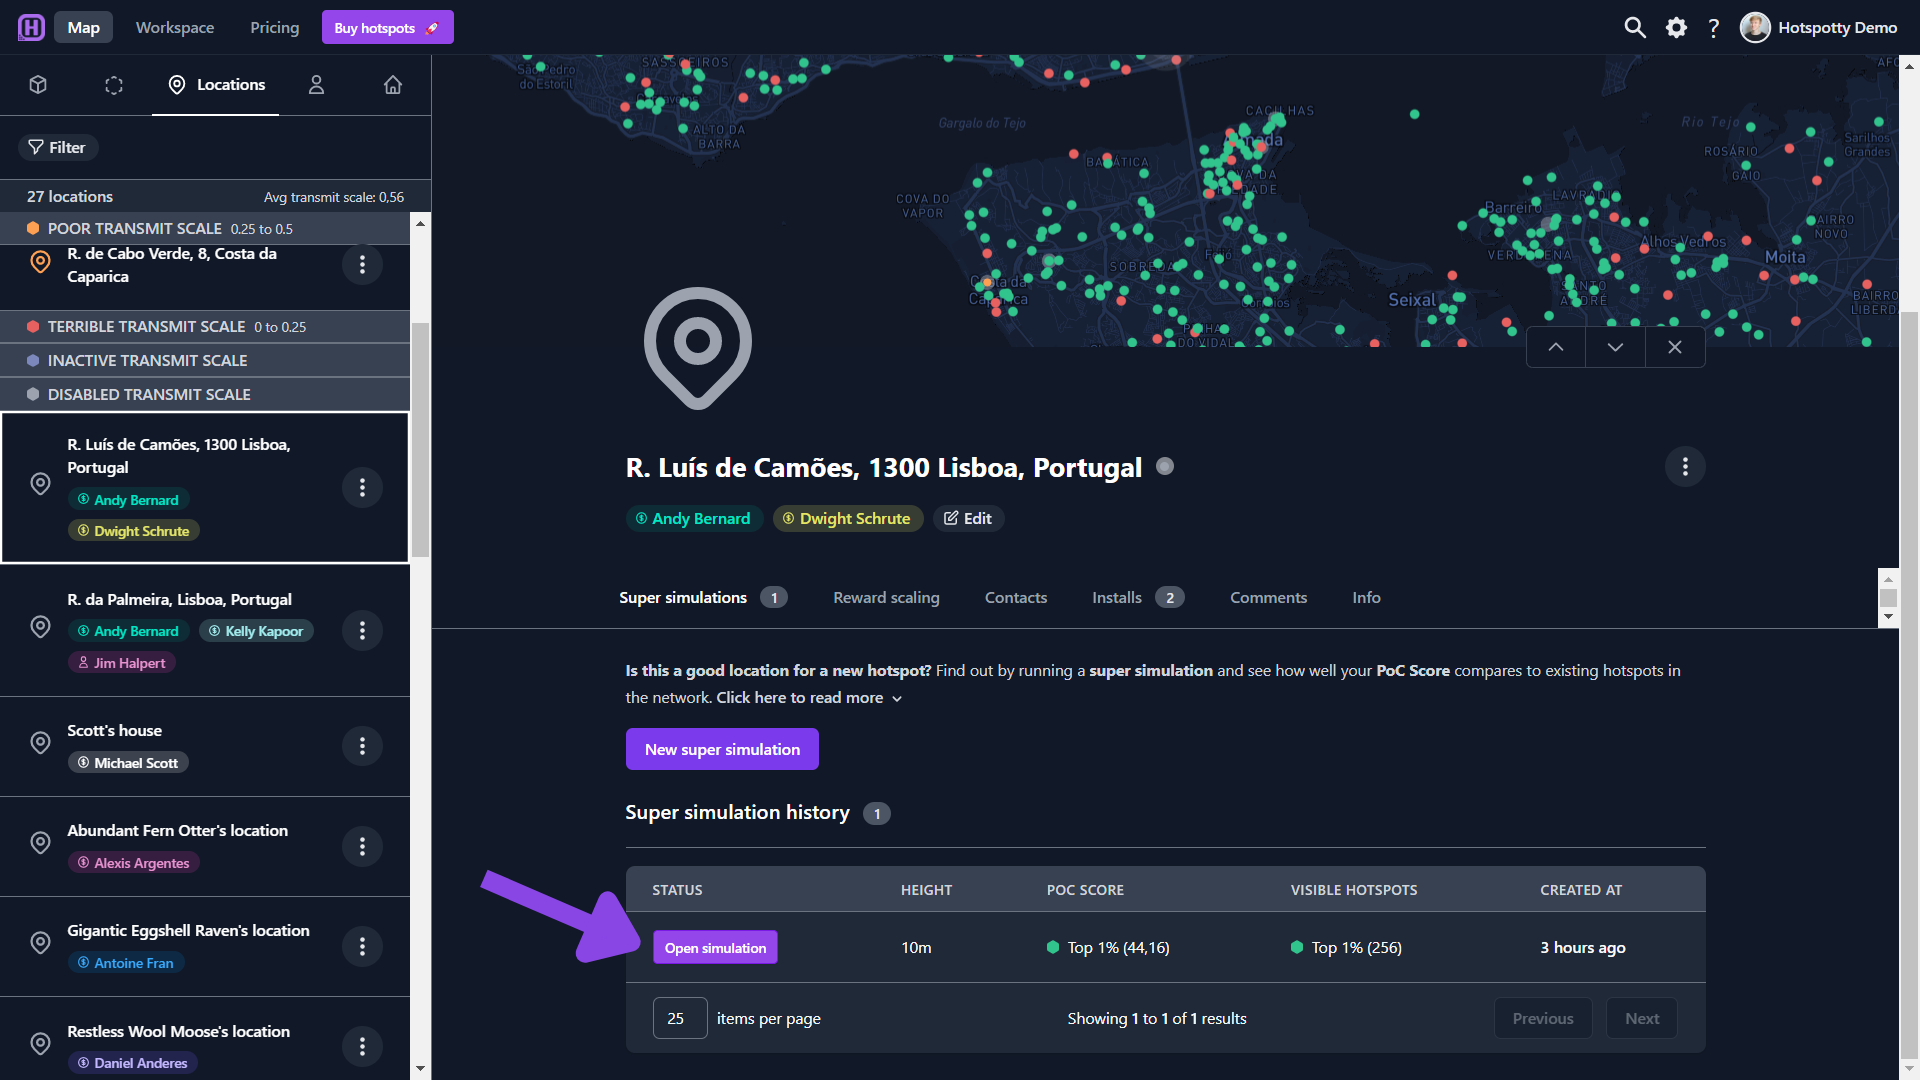
When a super simulation is finished, it can be opened. For each location, you'll see a history list with all previous created super simulations. Since the Helium network grows every day and your installation height might change over time, you can compare older super simulations with newer ones.
How do super simulations work and how do I know if the location is good or not?
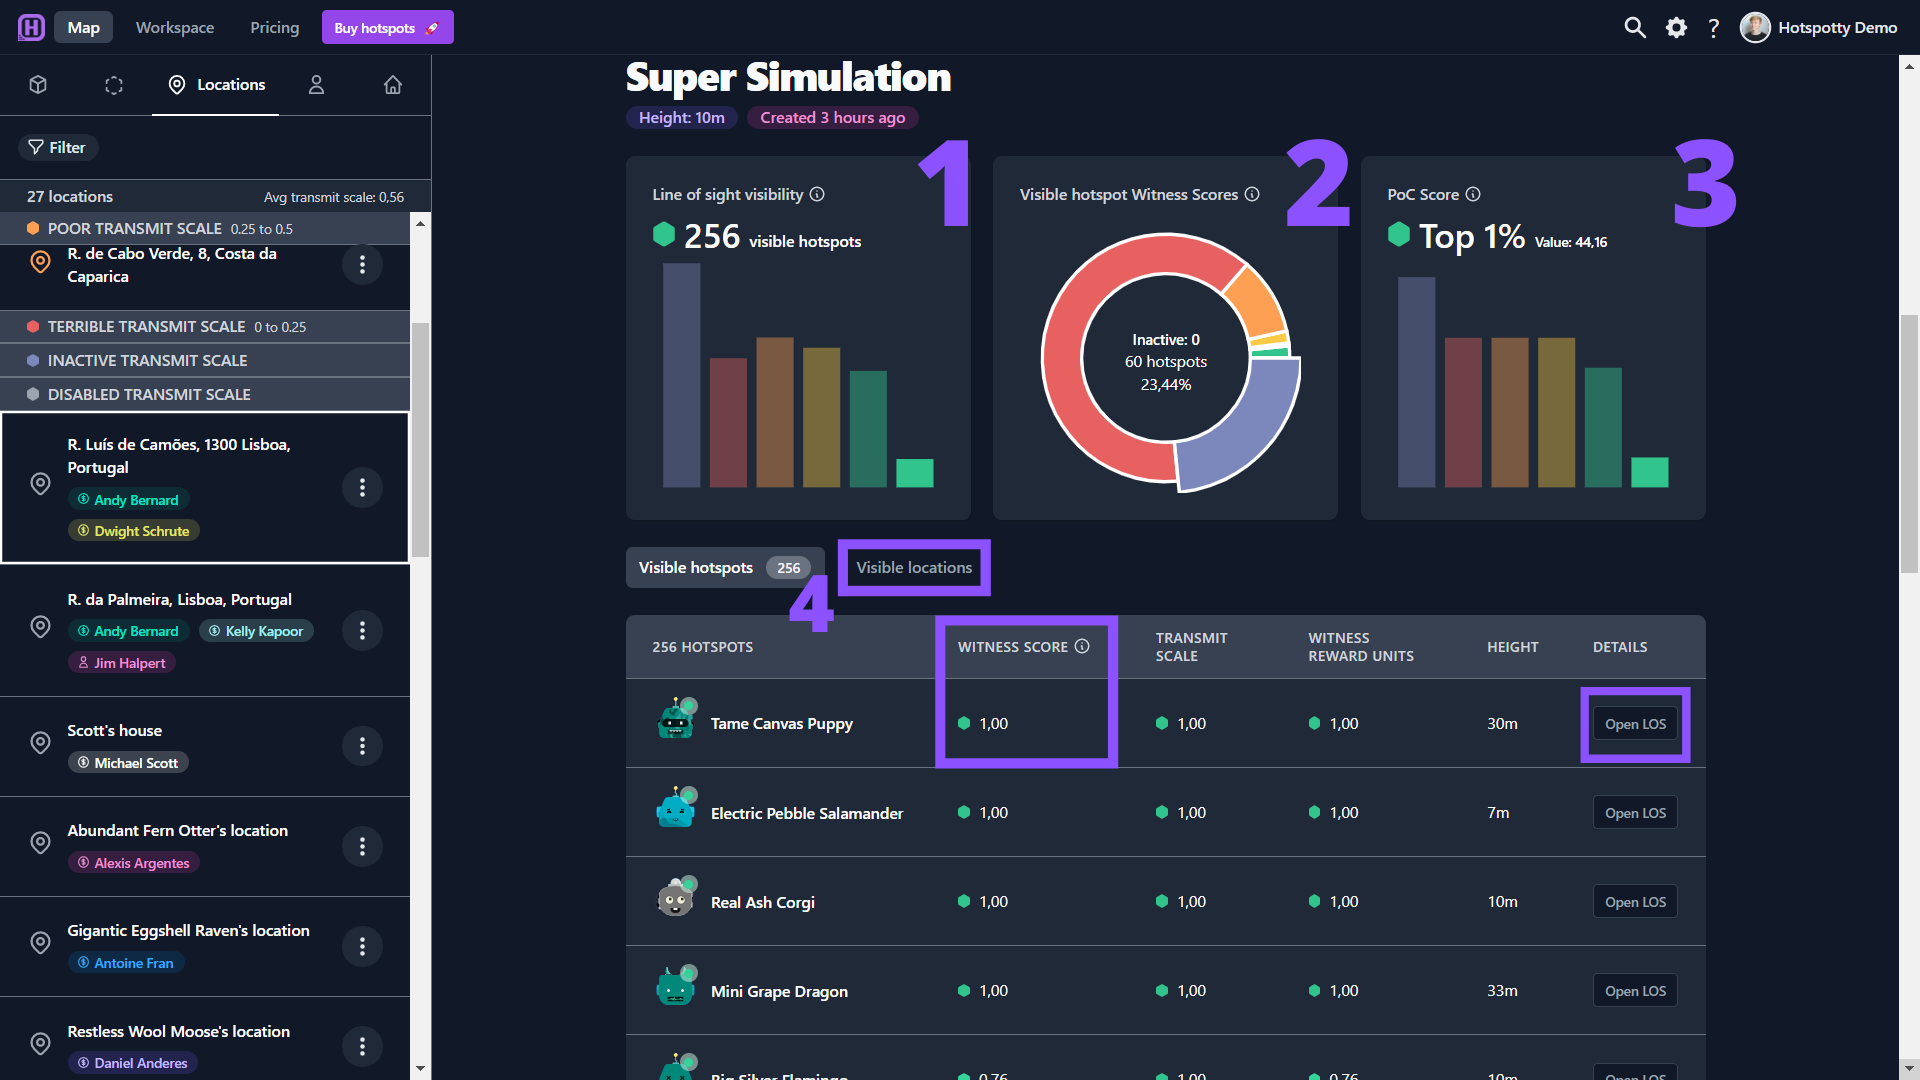
Line of sight visibility: The number of hotspots that are visible from this location at the given height is compared against how many witnesses hotspots have in the entire network. A default height of 10m is used for each hotspot or location for which a line of sight connection is calculated, unless a custom height is added to the blockchain or the location.
Visible hotspot witness score: This score is the product of the transmit scale and the witness reward units. This diagram represents what visible hotspots have a terrible witness score and what hotspots have good witness scores. The more green is represented in the diagram, the more likely you want to place a hotspot in that area. If there is a lot of red, it means that the area is already dense enough and placing a hotspot there would result in low earning witnesses.
PoC score: The PoC Score is a number that represents the PoC rewards potential in a way that can be directly compared to all other hotspots in the Helium network. The location gets a value assigned, the higher this value, the more valuable it is to put a hotspot on that location. Ideally you want the highest PoC score possible.
Visible hotspots: Underneath these 3 diagrams, you will find a list of all visible hotspots. Ranked from best to worst witness scores. For every seperate hotspot you can open the line of sight tool to get more info of what's in between the location and that hotspot.
Visible locations: This option is great for planning greenfield deployments where there is no coverage yet. Instead of checking all visible hotspots, the super simulation will look at all your locations added in your workspace. Please note that only locations available at the time of the super simulation were included in the simulation. We recommend you add an installation height to all your locations to get more accurate results.
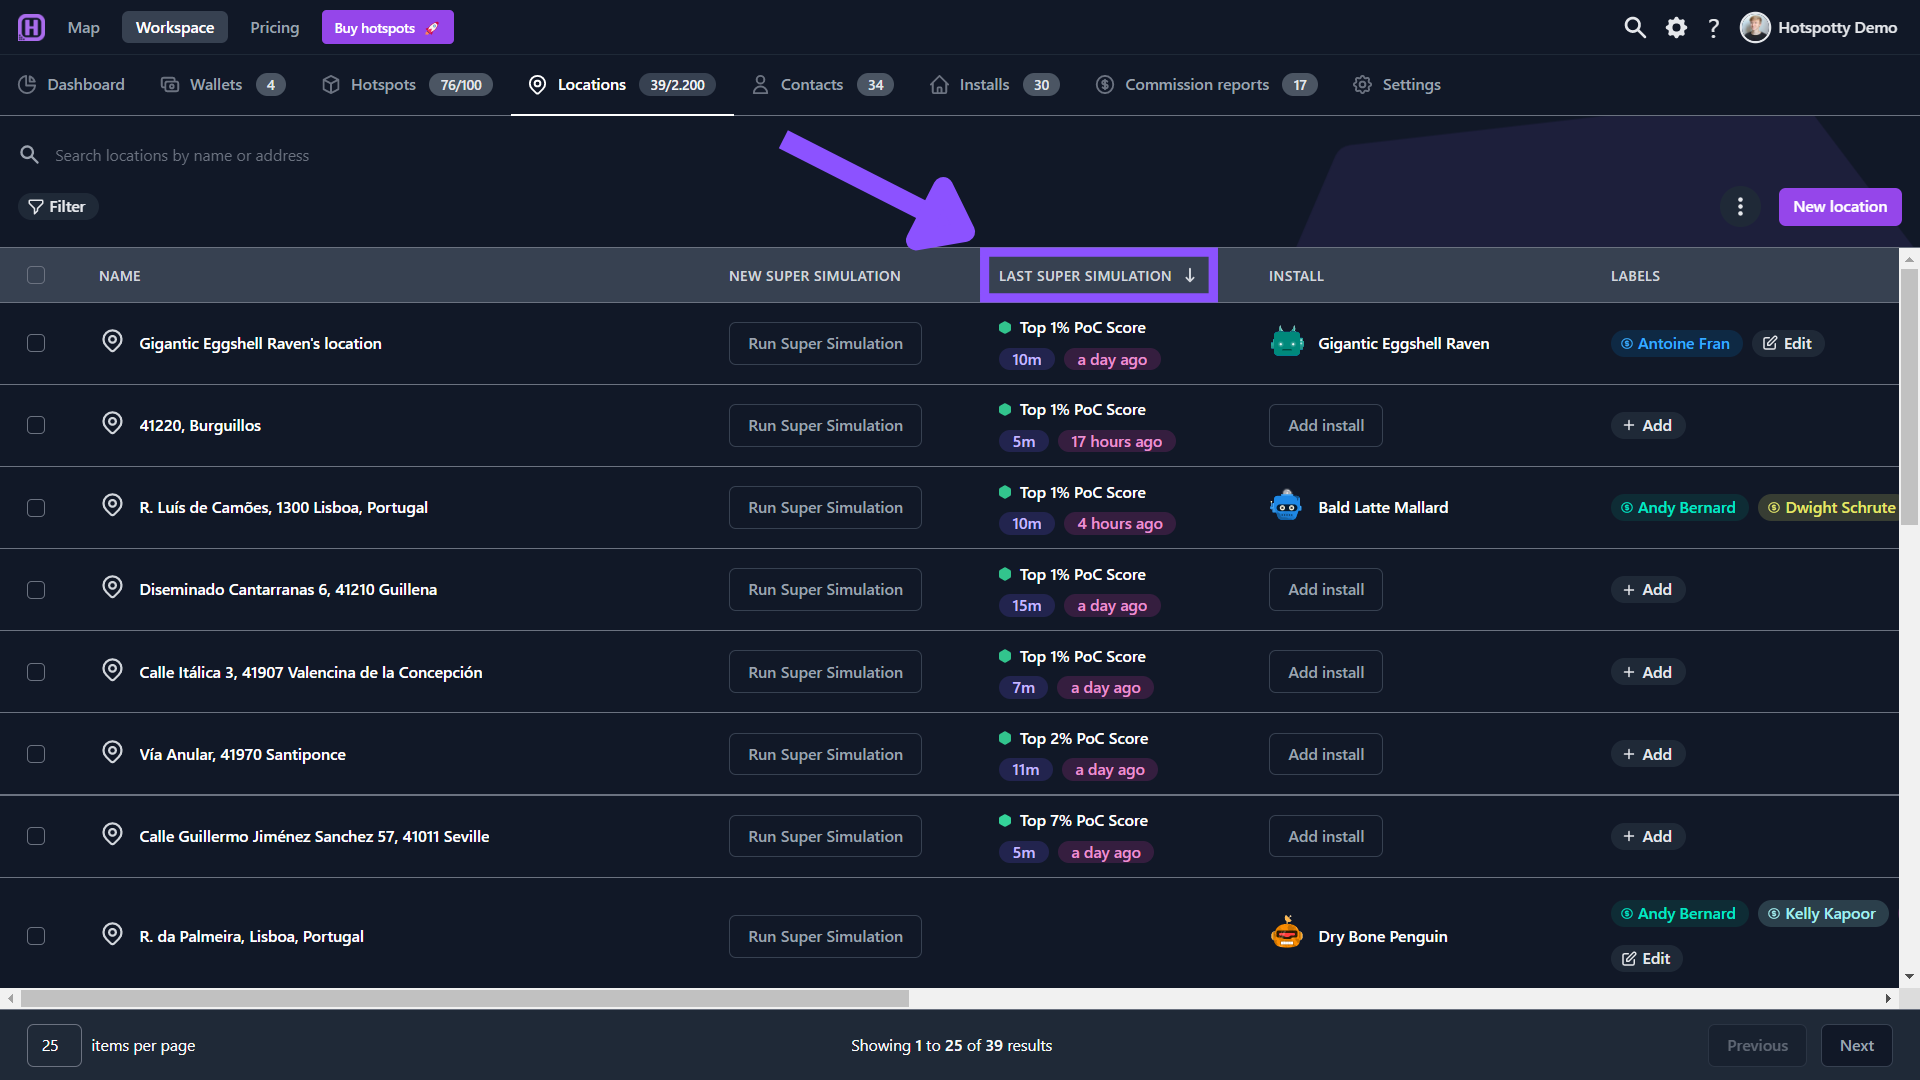
Rank your locations based on super simulations
- Go over to your Locations in your workspace.
- Double click LAST SUPER SIMULATION to rank your location from best PoC score to worst.
DISCLAIMER: Hotspotty super simulations use elevation profiles (NASA dataset), on-chain data (asserted hotspot height & coordinates) and user-entered data (location height). The results are a best-effort approximation and will likely differ from reality because not all this data reflects reality.